Log Analysis (Splunk Dashboard)
✅ Verified CompleteSIEM log analysis with interactive dashboards
Skills Demonstrated
- Splunk
- SPL Queries
- Log Analysis
- Dashboard Creation
Tools Used
Screenshots
Documentation
View on GitHubLog Analysis Lab - Splunk Syslog Dashboard
Goal
Demonstrate SIEM log analysis capabilities using Splunk to analyze system logs, detect security events, and create dashboards for monitoring. This project focuses on identifying failed login attempts, tracking system events, and monitoring sudo command usage from a Kali Linux VM.
Environment
- SIEM Platform: Splunk Enterprise (Free Trial)
- OS: Kali Linux VM
- Log Sources:
/var/log/syslog,/var/log/auth.log - Log Forwarding: rsyslog
- Tools Used: Splunk Search Processing Language (SPL), Splunk Enterprise
What I Did
1. Splunk Setup
- Installed and configured Splunk Enterprise
- Configured data inputs for syslog and auth.log
- Set up log forwarding from Kali Linux using rsyslog
- Created indexes for log storage
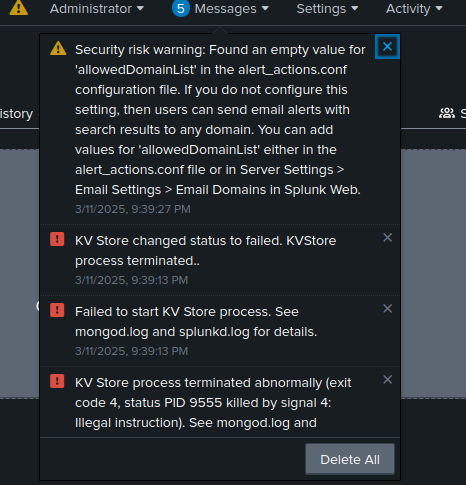
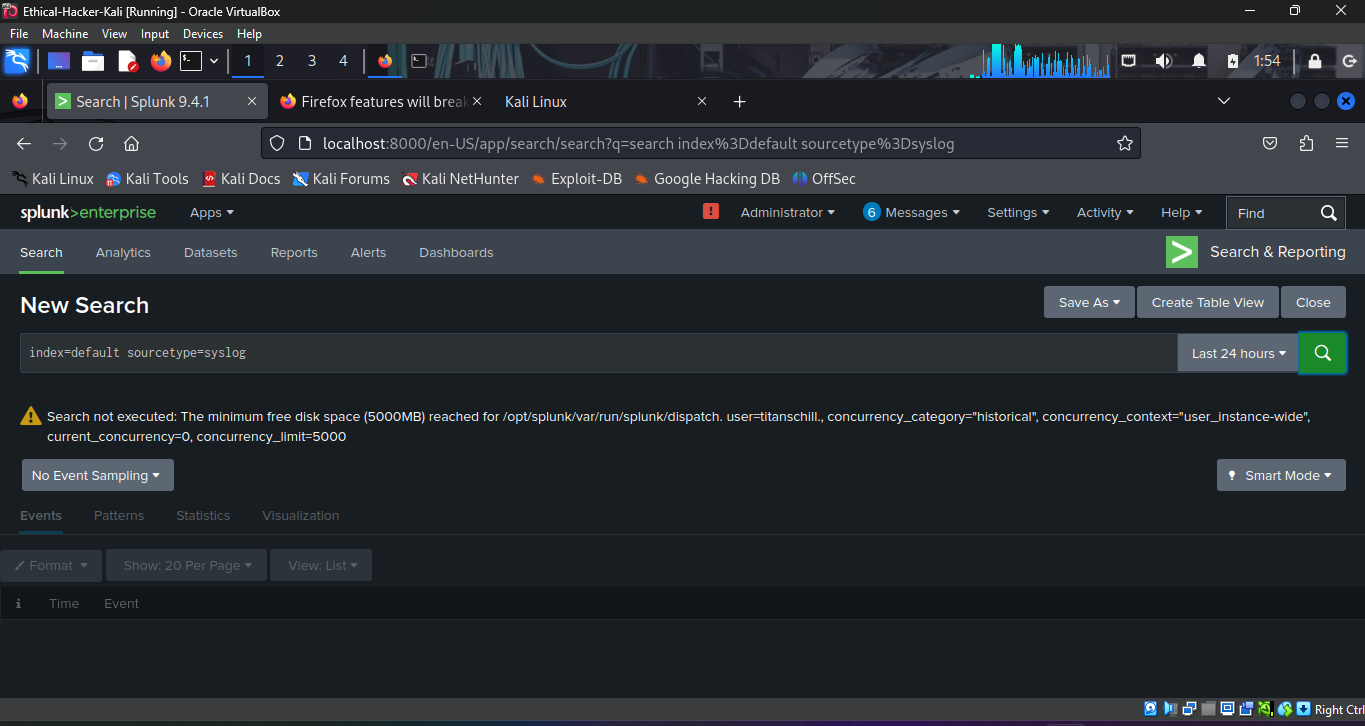
- Resolved disk space issues that interfered with log ingestion
2. Data Collection
- Configured rsyslog to forward logs to Splunk
- Verified log ingestion from Kali Linux VM
- Monitored
/var/log/syslogand/var/log/auth.log - Identified correct sourcetypes for proper log parsing
3. Query Development
Created Splunk queries for common security use cases:
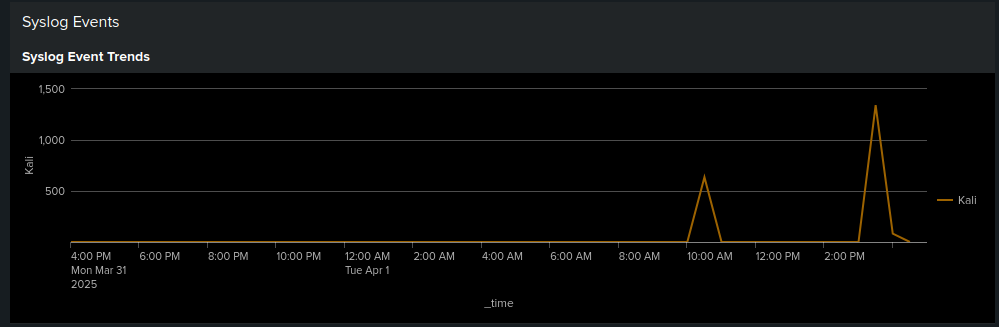
Syslog Event Trends:
index=* sourcetype=syslog
| timechart count by host
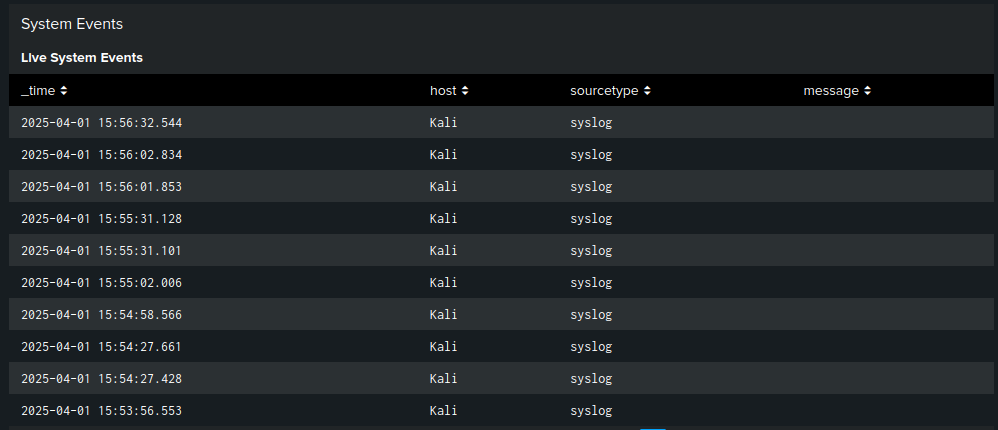
Live System Events:
index=* sourcetype=syslog
| table _time, host, sourcetype, message
| sort -_time
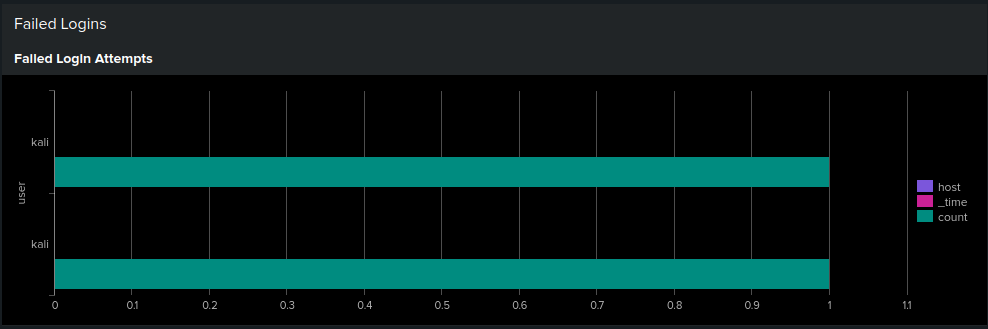
Failed Login Attempts:
index=* source="/var/log/auth.log" ("Failed password" OR "authentication failure")
| stats count by user, host, _time
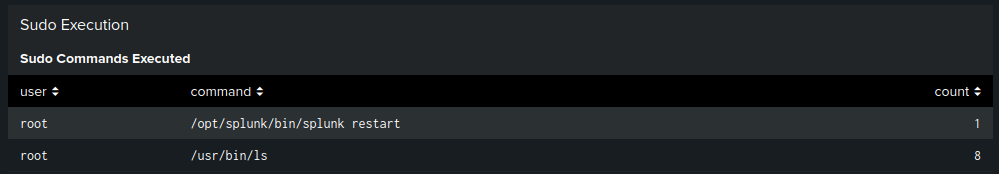
Sudo Commands Executed:
index=* source="/var/log/auth.log" "sudo:"
| rex "COMMAND=(?<command>.+)"
| stats count by user, command
4. Dashboard Creation
Built interactive dashboard (cybersecurity_log_analysis_dashboard.xml) with panels:
- Syslog Event Trends: Line chart displaying frequency of syslog events over time
- Live System Events: Real-time table showing recent syslog entries
- Failed Login Attempts: Count of failed SSH login attempts based on auth.log analysis
- Sudo Commands Executed: Displays which users ran sudo commands and what commands were executed
Evidence / Screenshots
Screenshots are stored in the screenshots/ folder:
 - Overview of system events over time
 - Authentication failure analysis
 - Privileged command monitoring
 - Real-time system monitoring
 - Splunk interface overview
 - Additional dashboard view
Findings
Key Observations
-
Failed Login Attempts:
- Successfully identified patterns of authentication failures from auth.log
- Tracked failed attempts by user and host with time-based analysis
- Queries can detect potential brute force attempts
-
System Events:
- Monitored system activity in real-time from syslog
- Tracked event trends over time using timechart
- Real-time table provides immediate visibility into system activity
-
Sudo Command Monitoring:
- Tracked privileged command execution using regex extraction
- Identified which users are executing sudo commands
- Extracted command details using
rexfor pattern matching
Challenges Overcome
- Sourcetype Identification: Identified correct sourcetype (auth-too_small) for proper log parsing
- Data Input Configuration: Edited data input sources to ensure log files were being monitored
- Regex Extraction: Used
rexcommand to extract sudo command details from log format - Disk Space Issues: Resolved Splunk health warnings by cleaning and restarting the instance
Splunk Queries Used
See splunk_queries.txt for the complete list of queries developed during this lab.
Outcome
In a Real SOC Scenario:
-
Alert Triage:
- Failed login attempts would trigger alerts
- Analysts would investigate using these queries
- Patterns would indicate brute force attacks
-
Incident Response:
- Sudo command monitoring helps detect privilege escalation
- System event tracking identifies anomalies
- Dashboards provide quick visibility into security posture
-
Continuous Monitoring:
- Dashboards run continuously
- Alerts configured for threshold breaches
- Regular review of query results
Actions Taken:
- ✅ Created reusable Splunk queries
- ✅ Built monitoring dashboards
- ✅ Documented query syntax and use cases
- ✅ Captured screenshots for documentation
Lessons Learned
- SPL Syntax: Splunk's search language is powerful for log analysis and correlation
- Sourcetype Configuration: Identifying the correct sourcetype is essential for getting expected results
- Data Input Management: Ensuring log files are properly monitored requires careful data input configuration
- Regex Extraction: Log entries like sudo usage sometimes require
rexextraction due to format differences - Dashboard Design: Visual dashboards are essential for quick triage and real-time monitoring
- System Health: Splunk health warnings (e.g., disk space) can interfere with ingestion and need monitoring
- Real-time vs. Historical: Both real-time and historical analysis are valuable for different use cases
Tools & Resources
- Splunk Documentation: splunk.com/docs
- SPL Reference: Splunk Search Processing Language guide
- Dashboard XML:
cybersecurity_log_analysis_dashboard.xml- Import this into Splunk to recreate the dashboard - Splunk Queries:
splunk_queries.txt- All queries used in this project
Next Steps / Future Improvements
- Set up alerts for brute-force detection and privilege escalation
- Expand monitoring to include firewall and application logs
- Create additional dashboards for specific security use cases
- Integrate with threat intelligence feeds
Related Projects
Note: This lab demonstrates fundamental SIEM log analysis skills essential for SOC analysts. The queries and dashboards can be adapted for production environments with proper tuning and data sources.
Evidence
- 6 dashboard screenshots
- Splunk queries
- Dashboard XML